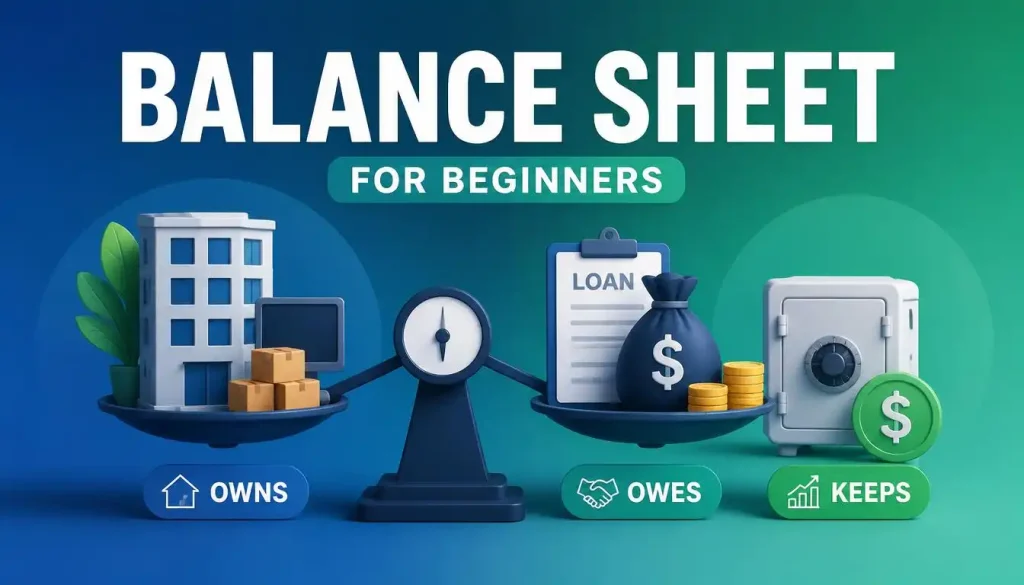
A balance sheet shows what a company holds and how it is financed at a particular date. Its basic identity is assets = liabilities + equity. A balanced equation establishes accounting consistency, not automatically financial health.
Build a small balance sheet
Assume cash of 100,000, receivables of 200,000, inventory of 300,000 and net fixed assets of 400,000. Assets total 1,000,000. Trade payables of 250,000, short-term loans of 150,000 and long-term loans of 200,000 create liabilities of 600,000, leaving equity of 400,000.
Equity is not a separate pile of cash. It is the accounting residual after liabilities are deducted from assets. Realisable asset values and settlement costs can differ, so book equity need not equal the market value of the business.
Total assets do not establish liquidity
Current assets in the example are 600,000 and current liabilities 400,000, giving a current ratio of 1.5. Yet only 100,000 is cash. Slow customer collections or unsold inventory can still make near-term payments difficult. The ratio alone does not establish how quickly assets can become usable funds.
Investigate quality and maturity
Receivable ageing, inventory obsolescence, asset valuation policies and debt maturities explain important details hidden by totals. Pledged assets and contingent obligations may also require reading the notes.
Across two reporting dates, receivables growing much faster than sales raise a collection question. Debt shifting toward short maturities can increase refinancing pressure. These are investigation signals rather than conclusive verdicts. The balance sheet describes resources and claims; the income statement describes period earnings, and the cash-flow statement explains actual money movements. Reading the three together prevents an attractive asset total from concealing a weak funding position.
The Balance Sheet Is a Snapshot, Not a Movie
A balance sheet shows financial position at a specific date. It tells you what the company controls, what it owes and the residual interest belonging to owners. It does not by itself explain what happened during the entire year. For that, the income statement and cash-flow statement are needed.
This snapshot nature matters because balances can move sharply around reporting dates. A company can collect receivables just before year-end, repay short-term debt or build inventory for a seasonal cycle. One balance sheet is useful; a sequence of balance sheets is much more informative.
The Accounting Equation Holds the Statement Together
The basic relationship is Assets = Liabilities + Equity. If a company owns 1 million of assets financed with 600,000 of liabilities, the residual equity is 400,000. Every transaction ultimately preserves this equation even though individual accounts change.
Buying equipment with cash changes the composition of assets but not total assets. Borrowing to buy equipment increases both assets and liabilities. Earning profit can increase equity through retained earnings, while dividends can reduce it.
Current Assets Describe Near-Term Resources
Current assets usually include cash, short-term investments, receivables, inventory and other resources expected to convert into cash or be used within the operating cycle. The exact classification rules depend on accounting standards and business type.
Not all current assets are equally liquid. Cash can be used immediately, receivables depend on customers paying, and inventory may require months to sell. A large current-asset total can therefore hide liquidity problems.
Receivables Need a Quality Check
Accounts receivable represent sales recognized before cash is collected. Growth in receivables can be normal when sales grow, but receivables rising much faster than revenue may signal slower collections, looser credit terms or aggressive revenue recognition.
Analysts compare receivable days, aging schedules and bad-debt allowances. A receivable is only as valuable as the probability that the customer will pay.
Inventory Can Be Valuable and Risky at the Same Time
Inventory may include raw materials, work in progress and finished goods. It supports future sales, but it also ties up cash and can become obsolete, damaged or unfashionable.
Rising inventory should be interpreted with the business cycle. A retailer building stock before a holiday season is different from a manufacturer accumulating unsold finished goods while orders fall. Inventory turnover and write-downs provide additional clues.
Non-Current Assets Show Longer-Term Investment
Property, plant and equipment, long-term investments, intangible assets and goodwill often sit in the non-current section. These resources are expected to support operations beyond the near term.
Book value is not necessarily market value. A factory purchased years ago may be worth more or less than its carrying amount. Conversely, an acquired brand or goodwill balance can be large even though it cannot easily be sold for cash.
Depreciation Changes Book Value, Not the Physical Asset Overnight
Long-lived assets are often expensed over time through depreciation or amortization. Accumulated depreciation reduces the carrying amount on the balance sheet, while the actual machine may still be operating productively.
A very old asset base can show low net book value and high reported returns on assets, but it may also require significant replacement spending soon. Reading the balance sheet with capital-expenditure history provides better context.
Current Liabilities Show Near-Term Claims on Cash
Accounts payable, short-term borrowings, accrued expenses and the current portion of long-term debt are common current liabilities. These obligations compete with payroll, inventory purchases and other uses of cash.
An increase in payables can temporarily support cash flow, but overdue supplier balances can damage operations. The maturity calendar matters as much as the total.
Long-Term Debt Changes Financial Risk
Long-term loans and bonds finance assets and growth without requiring immediate repayment of principal. They also create fixed obligations and refinancing risk. A company that is profitable can still face trouble if a large debt maturity arrives when credit markets are closed.
Analysts look at debt relative to cash, earnings and operating cash flow, as well as interest rates, covenants and currency. The balance sheet provides the starting amount; the notes explain the terms.
Equity Is the Residual Claim, Not a Cash Account
Shareholders’ equity can include contributed capital, retained earnings and other reserves. It is the accounting residual after liabilities are deducted from assets. A company with 500 million of equity does not necessarily have 500 million of cash available to owners.
Equity can rise through profitable retained earnings or new share issuance and fall through losses, dividends or share repurchases. Negative equity can result from accumulated losses or capital distributions and needs context.
Retained Earnings Connect Past Profits to the Balance Sheet
Retained earnings accumulate profits that were not distributed as dividends, adjusted for losses and other accounting items. They provide a bridge between the income statement and equity.
A large retained-earnings balance does not mean the same amount is sitting in cash. Those profits may have been reinvested in factories, inventory, acquisitions or debt repayment.
Working Capital Shows the Short-Term Operating Cushion
Net working capital is commonly calculated as current assets minus current liabilities. Positive working capital can indicate a short-term cushion, but the composition is crucial. A company with abundant cash and receivables differs from one whose current assets are mostly slow-moving inventory.
Some efficient businesses operate with low or even negative working capital because customers pay quickly while suppliers allow long terms. The business model determines what is healthy.
Liquidity Ratios Need Context
The current ratio divides current assets by current liabilities. The quick ratio excludes less liquid items such as inventory. These ratios help compare near-term resources with near-term obligations.
Ratios should be compared with the same company’s history and similar businesses. A supermarket can survive with lower working-capital ratios than a construction company with long project cycles.
A Simplified Balance Sheet Example
Assume a company has 200 cash, 300 receivables, 500 inventory and 1,000 of plant and equipment, for 2,000 total assets. It owes 400 to suppliers, 200 in short-term debt and 700 in long-term debt, for 1,300 total liabilities. Equity is therefore 700.
Now imagine inventory rises by 200 while cash falls by 200. Total assets and equity are unchanged, but liquidity may have worsened because cash became less immediately usable inventory. Balance-sheet analysis must go beyond totals.
Common-Size Analysis Helps Compare Companies
A common-size balance sheet expresses each account as a percentage of total assets. This makes it easier to compare a small company with a large one or to see how the asset mix changes over time.
If inventory moves from 15 percent to 30 percent of assets while revenue barely grows, that deserves investigation. If cash rises after a major share issue, the change may be intentional rather than operational.
Red Flags Often Appear in Relationships Between Accounts
Watch for receivables growing much faster than sales, inventory growing while demand falls, short-term debt rising to fund long-term assets, goodwill becoming unusually large after acquisitions, or cash shrinking while current liabilities accelerate.
No single red flag proves trouble. The balance sheet becomes powerful when these relationships are checked against profit, cash flow and management explanations.
A Beginner’s Balance-Sheet Reading Order
Start with cash and total debt to understand financial flexibility. Then review receivables and inventory for working-capital quality. Look at major long-term assets and whether they require heavy investment. Read current liabilities and the debt maturity profile. Finally, examine equity and retained earnings to see how the business has been financed over time.
After the first pass, compare at least two prior periods. The most useful question is not ‘Is this number large?’ but ‘Why did it change, and what does that change mean for liquidity, profitability and risk?’