A business can increase sales and still leave less money to cover its office, financing and taxes. The reason may sit between the selling price and the cost of what it sells. Gross profit makes that relationship visible. It is one of the first useful checkpoints when asking whether a product or service is economically worthwhile, but it is not the final measure of business success.
The number becomes much more informative when you separate its amount from its percentage, understand which costs it includes and compare like with like. The examples below are hypothetical and use simplified cost classifications. Actual reporting policies and the nature of the business determine where particular expenses appear in published financial statements.
The basic formula
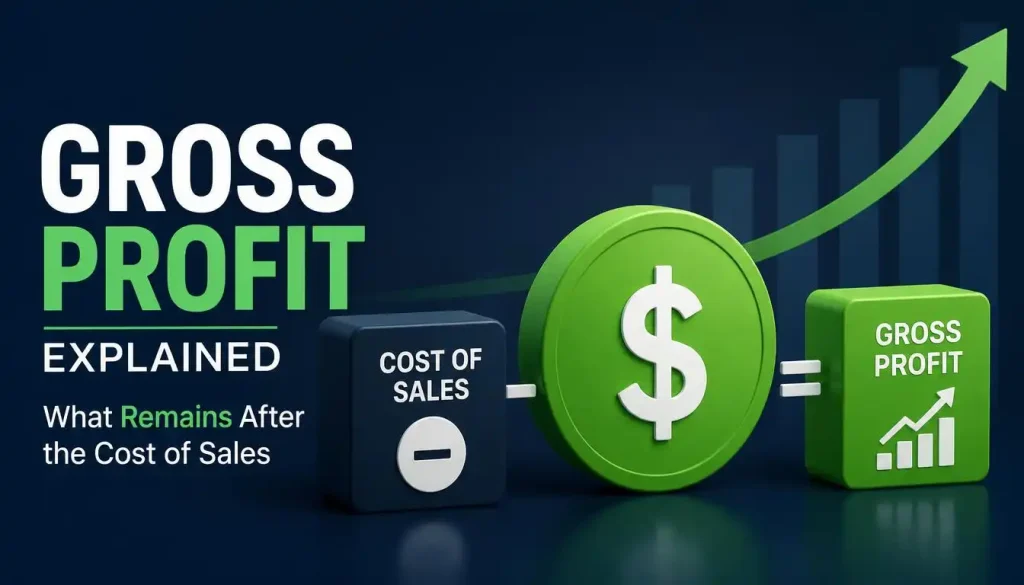
Gross profit equals net revenue minus cost of sales. If net revenue is 500,000 and the cost of the goods sold is 350,000, gross profit is 150,000. Gross margin is gross profit divided by net revenue, or 30% in this example. The amount tells you what remains; the percentage tells you how much remains from each unit of revenue.
Use net revenue consistently. Returns and discounts can reduce the revenue recognized, while taxes collected on behalf of a government are generally not the business’s own revenue. The exact presentation depends on the applicable rules. Starting from a gross invoice amount without understanding these adjustments can overstate the base used to calculate the margin.
Cost of sales is not every business expense
For a retailer, the cost of inventory sold is central. For a manufacturer, direct materials, production labor and appropriate manufacturing overhead can form part of product cost. A service business may include the costs directly associated with delivering its services. The precise boundaries require the company’s policy, not a universal list copied without context.
Marketing, head office administration, financing and taxes may appear below gross profit rather than in cost of sales. That does not make them optional or unimportant. Gross profit is the pool available to cover further expenses under that presentation. A healthy gross margin can coexist with an operating loss if those remaining costs are too high.
Follow one product from cost to selling price
Suppose a product sells for 100 and has a cost of sales of 70 per unit. Gross profit is 30 per unit and gross margin is 30%. Selling 1,000 units gives revenue of 100,000, cost of sales of 70,000 and gross profit of 30,000. This simple bridge links the unit economics to the total.
If the business also has 25,000 of operating expenses outside cost of sales, only 5,000 remains before financing and taxes in the simplified example. Gross profit of 30,000 is therefore not the amount owners can safely withdraw. Reading the next lines of the income statement is essential before treating a product’s apparent success as distributable money.
Margin and markup use different denominators
Margin divides gross profit by selling price. Markup divides gross profit by cost. With a selling price of 100 and a cost of 70, margin is 30%, while markup is approximately 42.86%. Both calculations are valid, but they answer different questions. Confusing them can produce a price that misses the intended profitability target.
If an item costs 80 and you want a 25% gross margin, divide 80 by 0.75 to obtain a price of approximately 106.67. Adding 25% to cost gives a price of 100, which produces a margin of only 20%. A pricing instruction should therefore state explicitly whether its percentage is a markup on cost or a margin on sales.
A discount can remove a large part of gross profit
Return to the product selling for 100 with a cost of 70. A 10% discount reduces the price to 90. Gross profit falls from 30 to 20, a decline of one third. Gross margin becomes approximately 22.22%. The discount is 10% of sales price but has a much larger percentage effect on the remaining gross profit.
To preserve the original total gross profit of 30,000, the business must sell 1,500 units at the new 20 per unit gross profit instead of 1,000 units at 30. That requires a 50% volume increase, assuming unit costs remain unchanged and there are no other effects. Additional capacity, delivery costs and returns can make the real requirement more demanding.
Cost inflation can squeeze the margin without lower sales
If the selling price stays at 100 and unit cost rises from 70 to 77, gross profit falls to 23 and gross margin to 23%. Revenue per unit has not changed, but the amount available for the rest of the business has decreased by seven. Higher sales volume might conceal this deterioration in the total revenue headline.
To keep a 30% margin with a cost of 77, the price would need to be 110 under the same simplified assumptions. That calculation does not prove customers will accept the price. It shows the economic requirement before considering competition, demand and negotiation. Pricing decisions need both arithmetic and evidence about what the market will buy.
Product mix can change the average
Imagine product A generates revenue of 100,000 at a 40% margin and product B generates 100,000 at a 20% margin. Total gross profit is 60,000 on revenue of 200,000, giving a 30% combined margin. Now suppose A produces 50,000 of revenue and B produces 150,000, with their individual margins unchanged.
Gross profit becomes 20,000 plus 30,000, or 50,000. The combined margin falls to 25%, even though neither product’s price or cost percentage changed. More revenue came from the lower margin item. This is why an average margin movement should be broken into price, cost and mix effects before blaming purchasing or sales execution.
Purchases are not automatically the cost of goods sold
A trading business may buy inventory during the period that remains unsold at the end. In a simple inventory reconciliation, beginning inventory plus purchases and relevant costs minus ending inventory equals cost of goods sold, subject to adjustments. Treating all purchases as current cost of sales would ignore what remains available for future sales.
For example, beginning inventory of 20,000 plus purchases of 90,000 minus ending inventory of 30,000 gives cost of goods sold of 80,000 in the simplified case. The cash paid for purchases can differ again because of supplier credit. Gross profit, inventory accounting and cash flow are connected, but they are not interchangeable measures.
Manufacturing overhead needs a consistent policy
A factory has costs beyond raw materials, including production labor, energy and equipment related overhead. How these costs are assigned to products affects reported gross profit. Some costs vary with output while others do not. A low production month can make the relationship between volume and unit cost less straightforward than a simple materials calculation suggests.
Compare periods using consistent accounting and investigate changes in allocation, capacity use and unusual production losses. Producing extra units only to spread fixed costs across more inventory does not guarantee stronger economics. It can leave cash tied up in stock and postpone recognition of costs. The demand for those units still matters.
Returns and quality problems belong in the analysis
A high invoice price can look attractive until returns, defects and rework are considered. If customers return products, net revenue may fall and the handling or replacement costs can affect the result. The accounting location of each item may vary, so the operational review should connect the financial statements with the underlying quality data.
Suppose one product appears to have a better gross margin but requires frequent replacements. Compare the retained revenue and the costs actually associated with fulfilling the sale. Do not count the initial sale as permanent success while ignoring its later reversal. Consistent treatment is especially important when comparing salespeople, customer groups or channels with different return patterns.
Gross margin is not contribution margin
Contribution margin typically subtracts variable costs for the purpose of analyzing how activity contributes toward fixed costs. Gross margin follows the cost of sales classification in the accounts. The two can differ because cost of sales may include fixed manufacturing overhead, while variable selling costs may appear elsewhere in the income statement.
For a short term order decision, the incremental costs and available capacity matter. For long term viability, the business must cover all necessary costs. Using gross margin as though it were always contribution margin can distort both decisions. State which measure you are using and why it fits the question rather than assuming every margin percentage is equivalent.
A higher percentage is not automatically a better business
A company with a 50% gross margin can have poor cash collection, heavy overhead or weak demand. A business with a lower margin may operate efficiently at high volume. Industry, distribution model, inventory risk and required capital influence the meaning of the number. There is no single gross margin target that is appropriate for every business.
Compare the company with its own history and with genuinely comparable businesses using similar classifications. A software service and a commodity distributor should not be judged by the same percentage alone. Ask how stable the gross profit is, how much capital it requires and whether it can cover the rest of the cost structure.
Build a useful monthly review
Start with net revenue, cost of sales, gross profit and gross margin. Then split changes into selling price, quantity, product mix and unit cost where the data allow. Review returns, production losses and classification changes separately. A short explanation supported by these drivers is more useful than saying the margin improved or deteriorated.
Assign actions to the actual cause. A purchasing cost issue differs from excessive discounting, unfavorable mix or low factory utilization. Before acting, confirm that the figures refer to the same period and units. Gross profit is a strong diagnostic tool when its boundaries are understood. It remains one stage of financial analysis, not a substitute for operating profit or cash flow.