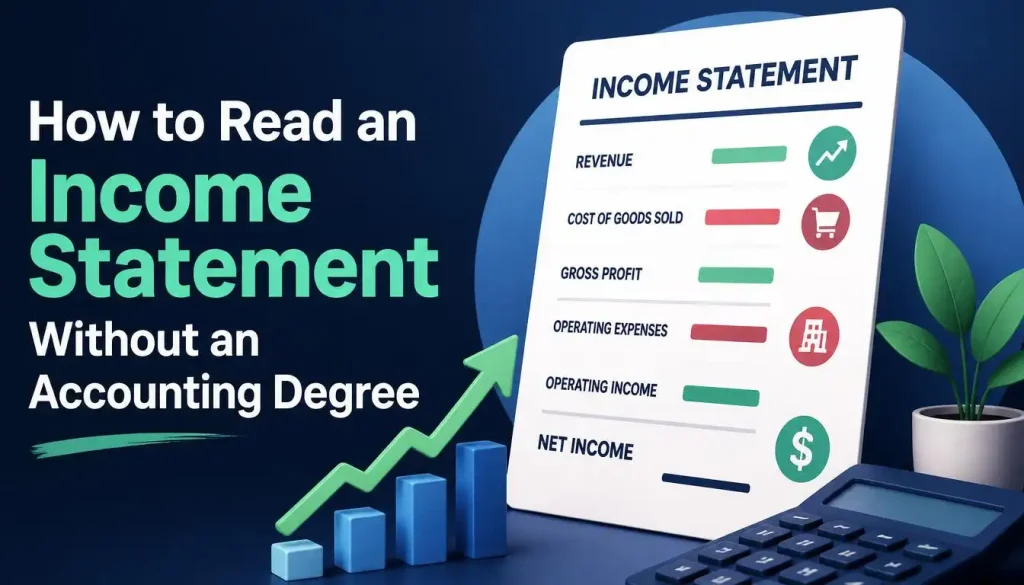
An income statement explains how a business moves from revenue to profit over a period. Unlike a balance sheet, it is not a snapshot at one date. Before reading the figures, check the reporting currency, whether amounts are in thousands or millions and whether the period covers a quarter or a full year.
Read the statement as a staircase
Suppose annual net sales are 2,000,000 and cost of sales is 1,300,000. Gross profit is 700,000. Operating expenses of 400,000 leave simplified operating profit of 300,000. Net financing costs of 80,000 and a hypothetical tax expense of 50,000 leave net profit of 170,000. The tax amount is illustrative, not a current statutory calculation.
Each step answers a different question: product economics, operating overhead and finally the broader result after financing and tax. Avoid subtracting the same expense at more than one step.
Separate growth from improved profitability
Next year, suppose sales rise to 2,400,000 while cost of sales rises to 1,680,000. Sales grow 20%, but gross profit only reaches 720,000. Gross margin falls from 35% to 30%. If operating expenses rise to 500,000, operating profit drops to 220,000 despite higher revenue.
The calculation identifies the pressure, not its definitive cause. Discounts, product mix and input prices are possible explanations requiring notes and management discussion. A hypothesis suggested by the numbers is not yet a demonstrated explanation.
Examine the quality of earnings
A property disposal can lift profit without improving repeatable trading performance. A restructuring charge can depress one period. Distinguish unusual items, but do not automatically discard every unfavourable expense labelled temporary. Repeated one-off charges deserve scrutiny.
Finally, profit is not the same as cash collected. Sales may remain unpaid and expenses may still be owed. The income statement explains recognised earnings; the cash-flow statement and balance sheet complete the picture of collection, obligations and financing.
Start With Revenue, but Do Not Stop There
Revenue is the top line because it records the value of goods or services sold during the period under the company’s accounting rules. Growth in revenue is useful, but the source of that growth matters. Sales can rise because the company sold more units, raised prices, acquired another business, entered new markets or benefited from currency movements. Those drivers have different implications for future performance.
Compare revenue growth with customer numbers, units sold, pricing and segment disclosures when those data are available. A company that grows only by discounting heavily can increase the top line while weakening margins. A company that grows through price increases may look strong today but could face lower demand later if customers resist the higher prices.
Gross Profit Shows the Economics of the Product or Service
Gross profit equals revenue minus the direct cost of producing the goods or services sold. In a manufacturer that can include materials and production labor; in other businesses the classification can differ. Gross margin is gross profit divided by revenue and is usually more useful than the absolute number because it allows comparison across periods of different size.
If gross margin falls while sales rise, ask why. Raw-material inflation, discounting, unfavorable product mix, freight costs or underused capacity can all reduce the margin. If gross margin improves, determine whether the improvement comes from sustainable pricing and efficiency or from a temporary cost decline.
Operating Expenses Tell You What It Costs to Run the Organization
Operating expenses typically include items such as sales and marketing, research and development, administration and other costs that support the business rather than directly produce each unit sold. The exact categories vary by industry, so comparisons should focus on consistent definitions.
Watch whether operating expenses grow faster or slower than revenue. A software business may intentionally spend heavily on sales staff or product development while expanding. A mature company may be expected to gain operating leverage, meaning revenue grows faster than overhead. Neither pattern is automatically good or bad without context.
Operating Profit Separates the Business Model From Financing
Operating profit, often called operating income or EBIT under certain presentations, shows the result after operating costs but before some financing and tax effects. It is useful because two companies with similar businesses can have very different debt structures. Looking at operating profit helps isolate how well the underlying operations perform.
Operating margin is operating profit divided by revenue. A rising margin can indicate better pricing, scale or cost control, while a falling margin can show competition, wage pressure, inefficient growth or capacity problems. Always compare the margin with the company’s own history and with similar businesses.
Interest Expense Reveals the Cost of the Capital Structure
A heavily indebted company may generate healthy operating profit and still produce weak profit for shareholders because interest consumes a large share of earnings. Interest expense becomes especially important when floating-rate debt reprices upward or when old low-cost debt must be refinanced at higher rates.
Do not look only at the current interest expense. Review the balance sheet and debt notes to understand maturities and average borrowing costs. The income statement shows today’s financing cost; the debt schedule can indicate whether that cost is likely to rise or fall.
Tax Expense Is Not Simply Revenue Times a Tax Rate
Corporate tax expense depends on taxable income, jurisdiction, tax credits, loss carryforwards, permanent differences and timing differences between accounting and tax rules. The effective tax rate can therefore differ from the statutory headline rate.
A one-year tax rate can be distorted by settlements, asset sales or deferred-tax adjustments. When analyzing trends, use several years and read the tax note if the effective rate changes sharply. For educational analysis, avoid assuming that the tax line is a simple percentage of pre-tax profit.
Net Income Is Important, but It Is the End of a Chain
Net income is the residual profit after the items above it, but it should not be read in isolation. The same net income can come from very different operating stories. One company may have rising revenue and stable margins; another may have flat operations but a one-time gain from selling an asset.
Ask what changed between operating profit and net income. Large gains, restructuring charges, litigation expenses or unusual tax items can make one year look much stronger or weaker than the normal business. Analysts often distinguish recurring earnings from clearly nonrecurring events, while remaining cautious about management-defined adjustments.
Earnings per Share Adds the Share Count to the Story
Earnings per share divides profit attributable to common shareholders by a weighted average number of shares. If a company repurchases shares, EPS can rise even when total profit is flat because the denominator becomes smaller. If it issues many new shares, EPS can lag profit growth.
Diluted EPS also considers securities that could become common shares, such as options or convertible instruments under applicable accounting rules. When a company emphasizes EPS growth, compare it with net-income growth and changes in the share count.
One-Time Items Can Distort Comparisons
Restructuring charges, impairment losses, gains on asset disposals and legal settlements can produce large swings. Some genuinely are unusual, but a company that reports ‘one-time’ charges every year may have a recurring cost disguised by the label.
Build two views when useful: reported results and a clearly documented normalized view. Do not simply remove every negative item. The purpose of normalization is to understand sustainable earning power, not to manufacture a more attractive number.
Margins Make Different-Sized Companies Comparable
Gross margin, operating margin and net margin convert income-statement levels into percentages of revenue. This makes it easier to compare a company with its own past or with a competitor of different size. The sequence of margins also shows where pressure enters the business.
For example, stable gross margin but falling operating margin points toward overhead growth rather than production economics. Stable operating margin but falling net margin can point toward interest or tax effects. Reading the margin ladder turns the statement into a diagnosis rather than a list of numbers.
Quarterly Results Need Seasonality Context
Retailers, travel companies, agricultural businesses and many industrial firms have seasonal sales patterns. Comparing the December quarter with the September quarter can be misleading if the business always peaks at year-end. Year-over-year comparison or trailing twelve-month totals can be more informative.
Also check whether the fiscal year matches the calendar year. Companies can have non-December year-ends. Always confirm the period before calculating growth rates.
Revenue Quality Matters
High-quality revenue is generally supported by real customer demand and reasonable collection terms. Aggressive discounts, extended payment periods or unusually large end-of-quarter shipments can increase reported sales while creating future problems.
The income statement alone cannot prove revenue quality. Cross-check accounts receivable, deferred revenue, customer concentration and operating cash flow. If revenue rises quickly but cash collection deteriorates, the balance sheet and cash-flow statement may reveal the tension.
Link the Income Statement to the Balance Sheet
The three statements are connected. Credit sales increase revenue and accounts receivable. Depreciation expense reduces profit and accumulated book value of fixed assets. Interest expense relates to debt on the balance sheet. Inventory decisions affect cost of goods sold and working capital.
Reading only the income statement can therefore miss the financing required to produce the reported profit. Strong analysis follows important lines into the balance sheet and cash-flow statement.
A Five-Minute Reading Sequence
First confirm the reporting period and currency. Second, compare revenue with the prior period. Third, calculate gross, operating and net margins. Fourth, identify the largest changes in operating expenses. Fifth, check interest, tax and unusual items. Sixth, compare net income with operating cash flow. Finally, read management’s explanation and test it against the numbers.
This sequence will not replace a full financial analysis, but it prevents a common mistake: jumping straight to net profit without understanding how the company reached it.